How to Create Visually Stunning Infographics
Infographics have become an essential tool for conveying complex information in a visually appealing format. They combine both text and visuals to present data and statistics in a way that is easily understandable and engaging. Whether you are creating infographics for personal or professional use, here are some tips to help you create visually stunning infographics that will capture attention and effectively communicate your message.
1. Begin with a Clear Goal: Before you start designing your infographic, it’s important to have a clear understanding of what you want to achieve. Determine the purpose of your infographic – is it to inform, educate, or persuade? Having a clear goal in mind will help guide your design choices and ensure that your infographic communicates your intended message effectively.
2. Choose the Right Data: Collect and analyze the data you want to present in your infographic. Identify the key points that you want to highlight and consider which visuals will best represent that information. Make sure the data you choose is relevant, accurate, and supports your main message.
3. Simplify and Organize: One of the key principles of creating visually stunning infographics is to simplify complex information. Break down complex concepts into smaller, more manageable elements. Use concise and clear language, and opt for visual representations such as icons, charts, and graphs to make the information easier to understand. Organize the information in a logical flow, so that readers can follow the story of your infographic effortlessly.
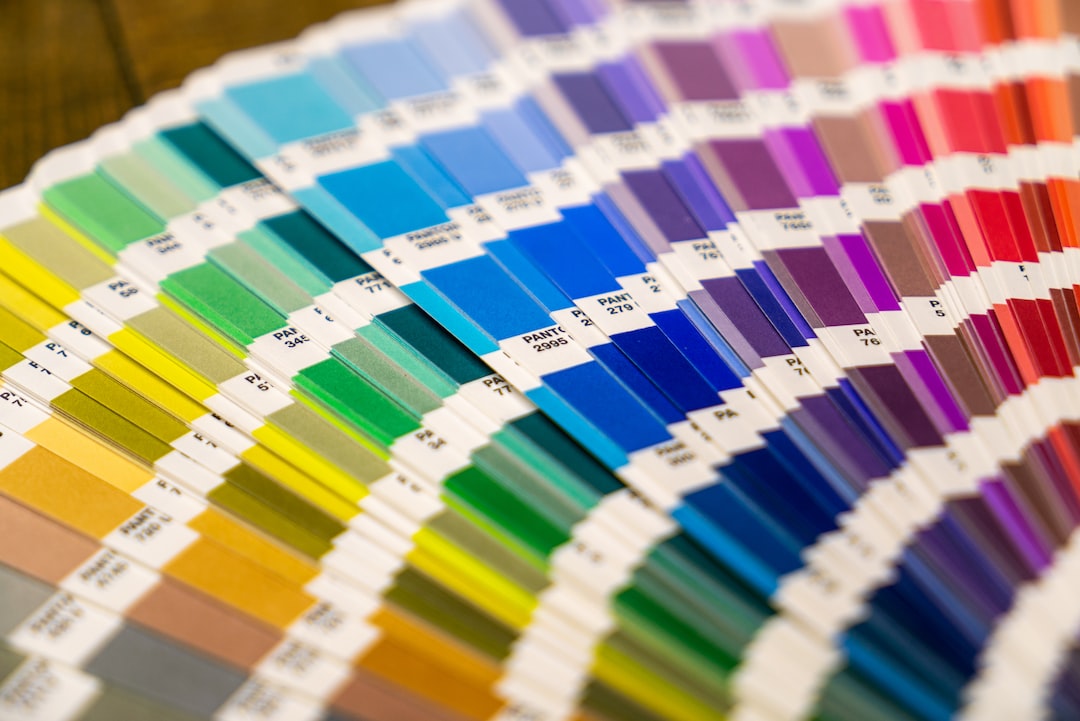
4. Choose a Theme and Color Palette: The visual appeal of your infographic largely depends on the theme and color palette you choose. Select a theme that aligns with your content and target audience. Consider using colors that evoke the right emotions and enhance the readability of your infographic. Use contrasting colors to make important information stand out, while maintaining a cohesive and harmonious color scheme.
5. Design for Readability: One of the most important aspects of designing stunning infographics is to prioritize readability. Choose a font that is easy to read and avoid using too many different fonts in one design. Make sure the text is large enough to be legible, even when viewed on smaller screens. Break up the text into smaller chunks and use headings, subheadings, and bullet points to make it more scannable.
6. Emphasize Visual Hierarchy: Use visual hierarchy techniques to guide readers through your infographic in a logical order. Highlight the most important information by using larger fonts, bolder colors, or placing it at the top or center of the design. Create a visual flow that leads the viewer from one section to another, ultimately delivering your main message.
7. Incorporate Engaging Visuals: Infographics are all about visuals, so make sure to include captivating and relevant graphics that complement your data. Use high-quality images, illustrations, icons, or even animated elements to bring your information to life. However, avoid overcrowding your design and ensure that the visuals you choose enhance the overall message rather than distract from it.
8. Encourage Sharing and Interactivity: To maximize the impact of your infographic, encourage sharing and interactivity. Add social sharing buttons to make it easy for people to share your infographic on various platforms. Consider making your infographic interactive by adding clickable elements or embedded videos that provide additional information or engage the viewer in a meaningful way.
9. Optimize for Different Platforms: Infographics can be shared and viewed across various platforms, including websites, social media, and email. To ensure that your infographic looks stunning on every platform, optimize it for different screen sizes and formats. Test your design on different devices to ensure it remains visually appealing and readable.
10. Gather Feedback and Iterate: Finally, don’t forget to gather feedback from others and iterate on your design. Share your infographic with colleagues, friends, or online communities to gain insights and suggestions for improvement. Be open to feedback and refine your design based on the feedback received, ensuring that your infographic becomes even more visually stunning.
Creating visually stunning infographics requires a combination of creativity, strategic thinking, and attention to detail. By following these tips, you can create infographics that not only captivate your audience but also effectively convey your message to make a lasting impact. So, get started and unleash your visual storytelling skills to create stunning infographics that stand out in a sea of information.
